Other Tools
Settings

The Settings tool will open up the Viewer Settings where you can customize the viewer.
Export

The export tool allows you to download the study in either DICOM or JPEG format. Pressing this tool will open the Export Study Dialog.
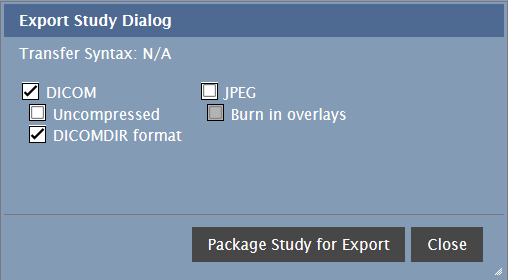
For DICOM format you can export the study in uncompressed DICOM format by checking the Uncompressed checkbox. You can export the study as a DICOMDIR by checking the DICOMDIR format checkbox.
For JPEG format you can burn in overlays by checking the checkbox.
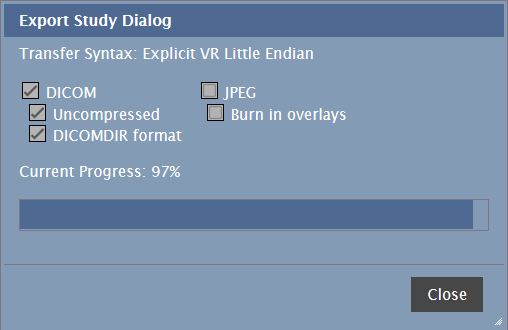
Press the Package Study for Export button to begin packaging the study. You will see a progress bar showing the current progress.
When Packaging is complete, press the Download button to download the study.
The exported study is saved in the default download location for the browser.
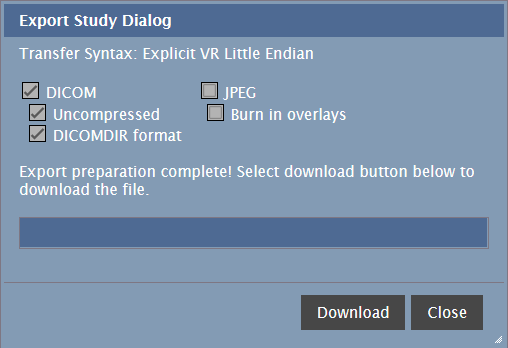
When you are finished, press the Close button to close the dialog.
DICOM Tag Viewer

The DICOM Tag Viewer tool will open the DICOM Tag Viewer for the currently selected image.
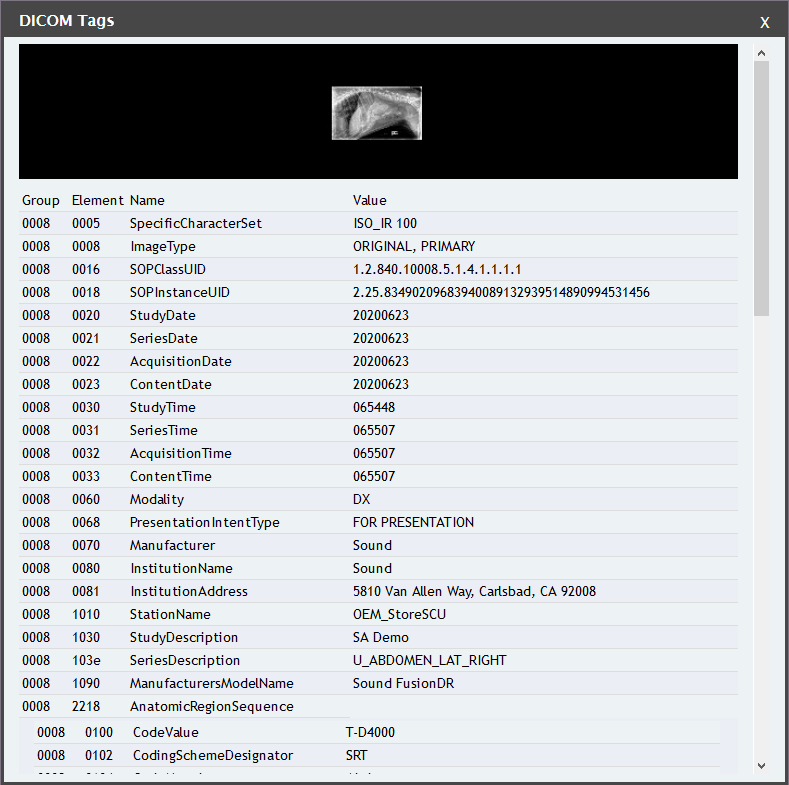
To close the DICOM Tag Viewer. press the X in the top right corner.
DICOM Tag Editor

The DICOM Tag Editor is a tool that is only available to the admin user. Pressing this tool will open the Tag Edit Dialog.

Here you can edit select DICOM Tags. Press the OK button to save your changes. Pressing the Cancel button will close the dialog and not save your changes.
Secondary Capture

The Secondary Capture tool allows you to capture a single MPR Viewport as a separate stack.
- Annotations including templates, cut fragments, text, and any measurement item displayed within the viewport.
- The Overlay is an optional item to be included in the capture. By default, the screen capture will not include the Overlay information burned into the image. This can be changed in the Viewer User Preferences on the General tab
- The View settings such as Zoom, W/L, Pan, etc. will be captured in the Secondary Capture exactly as they are displayed in the viewport at the time the tool is used.
- The second capture image will be stored in the archive as a new series to the study of the image displayed in the current viewport.
- The image is stored as a true color image, with 8 bits per channel.
- The image is captured at the same resolution of the active Viewport.
- The image is routed following automatic routing rules defined in the DICOM Settings

The Secondary Capture All Screen tool allows you to capture and add all Viewports as a separate tack.
The new image will appear with the label "OT" as a 1 image stack.
Screen Capture

The Screen Capture tool allows you to save a PNG image of the selected image in its current state.

The Screen Capture All Screen allows you to generate an image consisting of all viewports in the viewer, saved as a PNG image.
By default, screen captures do not include overlays. To include overlays, enable the Screen Capture with Overlays option in the Viewer Settings.
The screen capture will be saved in the default download location for the browser.
Move Image
In the Study List, you can Cut and Paste entire studies. In order to Cut and Paste individual images, you will need to use the Move Image Tools in the Viewer. Pressing on the Move Image to Clipboard button will move the currently selected image to the clipboard. After all the desired images are on the clipboard, you will need to return to the Study List to complete the move. You can read about this process here.
This tool is only available to the admin user

With the image in the clipboard, you can now paste it into a selected study, patient, or new study on the Study List.

When there are items on the Clipboard, the Clipboard Tool will be active. To view items in your Clipboard, press the Clipboard tool. This will open the clipboard.
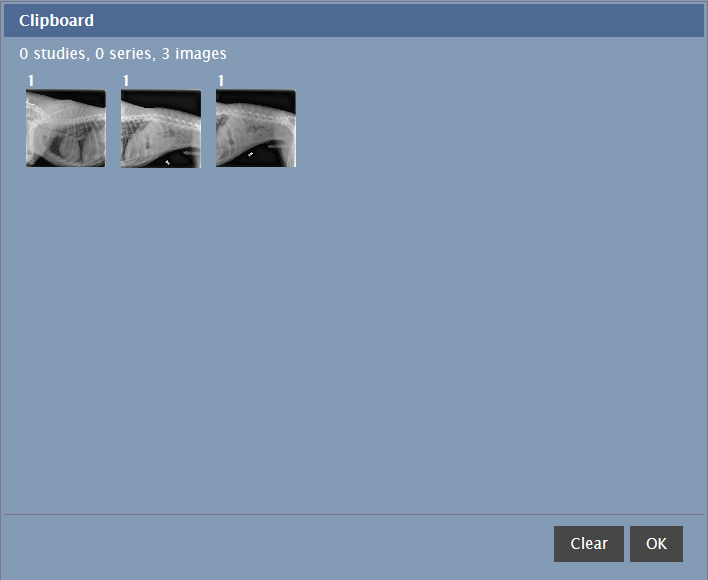
The Clipboard shows a thumbnail for each image on the Clipboard. You can clear the Clipboard by pressing the Clear button. To close the Clipboard, press the OK button.
Pixel Intensity

The Pixel Intensity tool is an interactive tool that will display the pixel value at the point where the tool is used on the image (Hounsfield Units). To use the tool, select it, and press and hold on the image where you want to see the pixel intensity.
Hanging Protocols

To apply a hanging protocol, click this icon and select the Hanging Protocol you would like to apply.
The icon will be disabled if there are no hanging protocols that match the current study. You can define Hanging Protocols in the Viewer Settings.
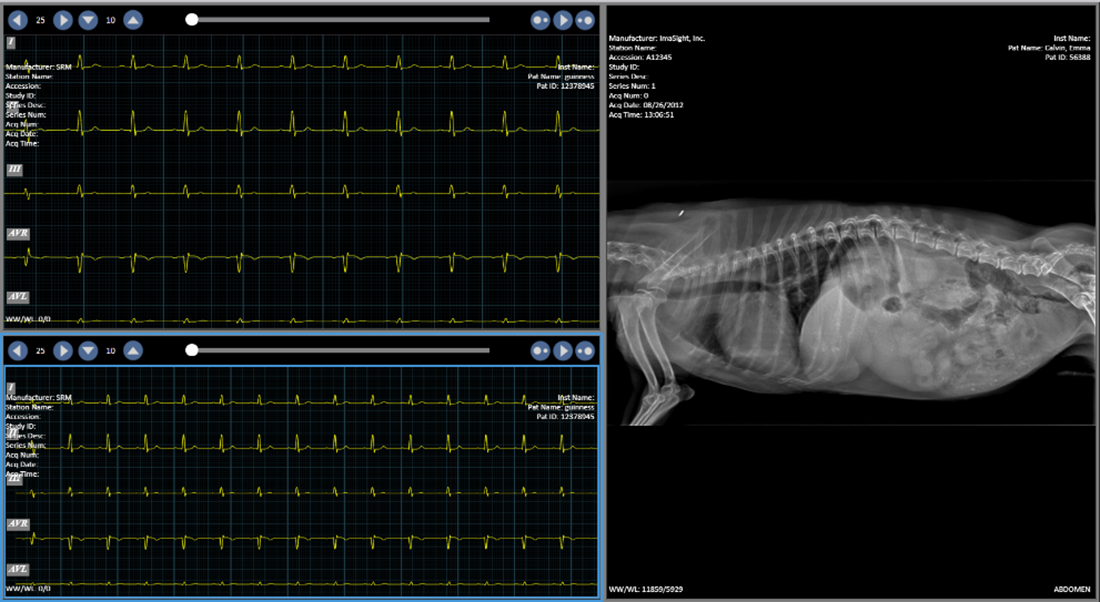
ECG (Electrocardiogram) Display
The viewer supports ECG display and to modify dialog boxes, you can drag the box to the desired area on your screen, then drag the borders in any direction to change the size.
For mobile devices, follow the instructions using single-touch gestures.
ECG images can be viewed alongside other images within the same Viewer session.
Adjusting the Cine mode
- Automatic play through: Select Play Cine

- Stop play through: Select Stop Cine

- Increase the speed at which the traces are cycled through: Select Increase Cine Speed

- Decrease the speed at which the traces are cycled through: Select Decrease Cine Speed

- Change frequency of traces: Select Right Arrow
 to increase, Left Arrow
  to decrease.
 - Change amplitude of traces: Select Up Arrow
 to increase, Down Arrow
  to decrease.
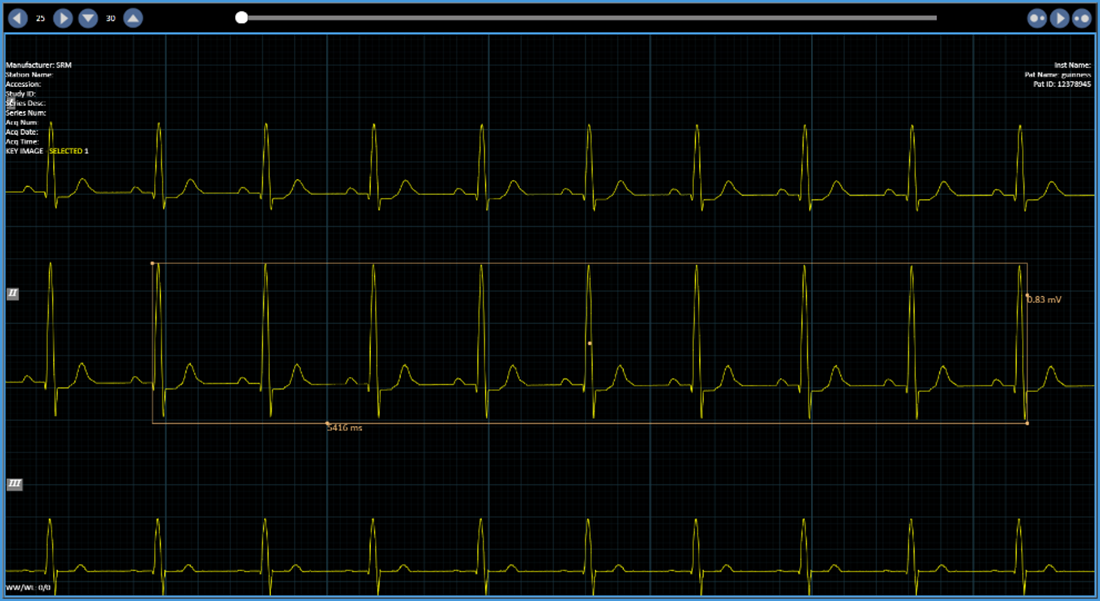
ECG Group Tool
Add ECG Group tool  to your toolbar for easy access to all ECG tools.
- Measure speed: Select ECG Line
 > Click and drag horizontally to measure in ms.
 - Measure amplitude: Select ECG Line > Click and drag vertically to measure in mV.
- Measure speed and amplitude simultaneously: Select ECG Box
 > Click and drag diagonally to measure in ms and mV.
US Region Recalibration Module
US Calibration Module is available for all US studies with a set region identified in the DICOM tag. This feature presents physical information of multiple regions in a region independent of each other. This module in the viewer allows the user to make different measurements within a single US study that contains multiple data regions as you see here:
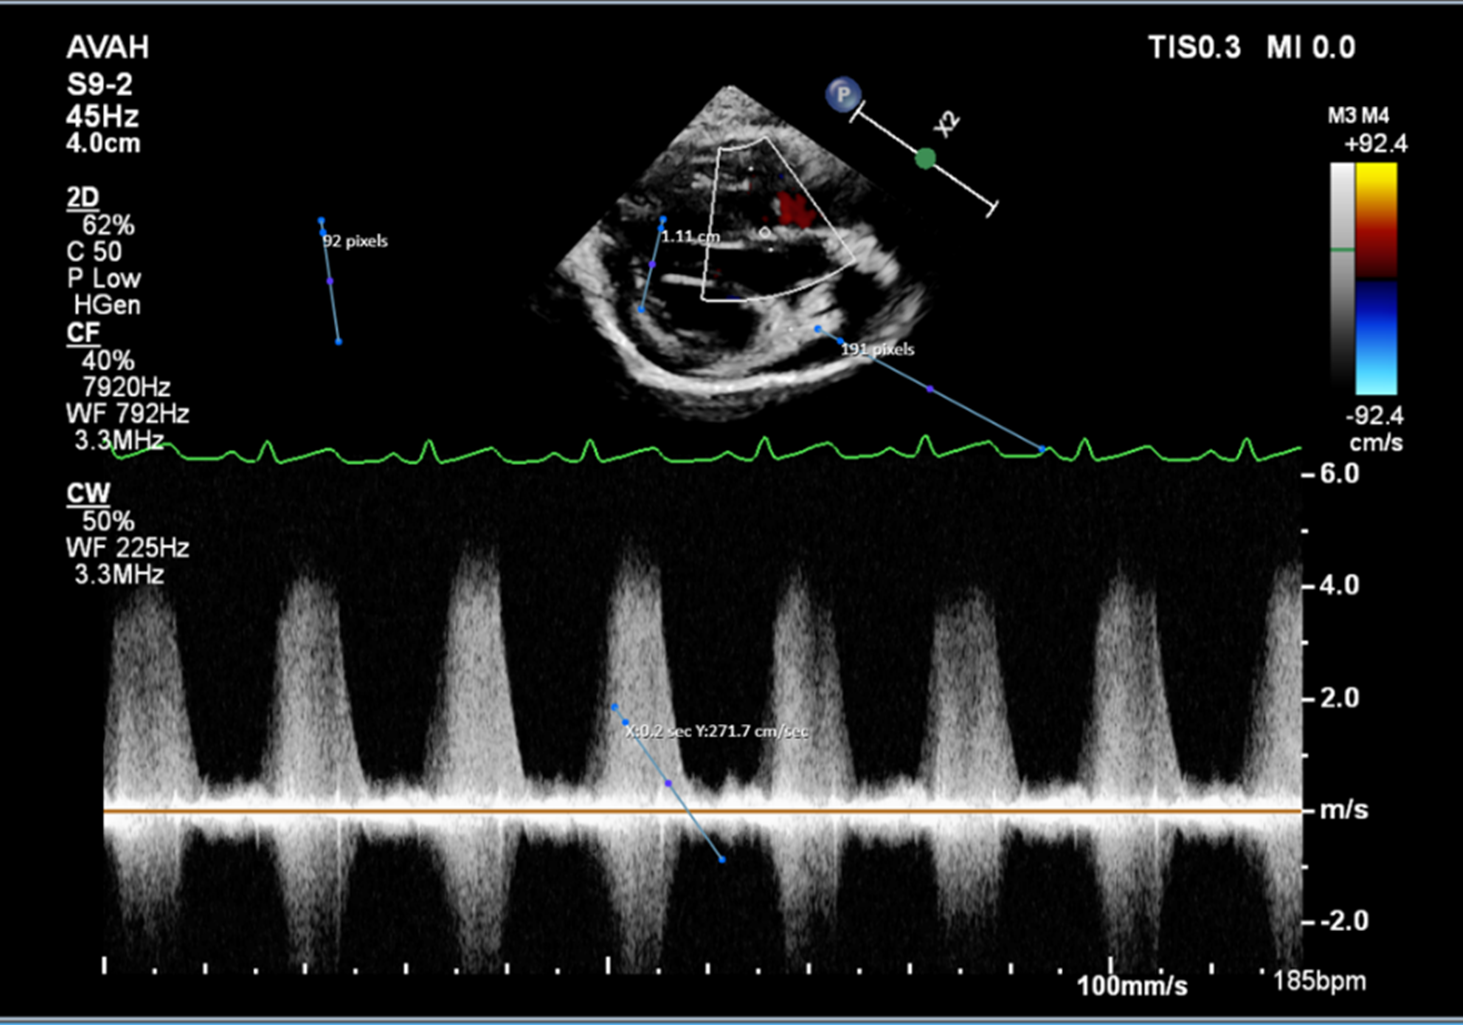
When a user opens such a study like this, they will be able to draw line measurements (like above) to capture the specific type of data within each region. Additionally, they will be able to edit/delete said measurements (as you would a regular line measurement) as well as save them.
Viewer will block any measurements drawn across the different regions.
Refer to the DICOM Standard for more information on this module.